







A residual-value dataset combining ALG, Glass's Guide, Schwacke and EurotaxGlass's inputs into harmonised per-segment depreciation curves across five major markets.
What the Depreciation Tracker measures
The Global Vehicle Depreciation Tracker is a meta-index. It does not collect primary transaction data itself; instead, it normalises and aggregates publicly available residual-value forecasts from established national valuation guides and trade-auction datasets, expressing results as a percentage of original list price retained at fixed ownership intervals — typically 12, 24, 36, 48 and 60 months. The 2020 release was the first version to combine European forecast-based data with North American auction-based data on a single comparable basis, and remains the reference baseline against which subsequent annual updates are calibrated.

The tracker is designed to answer one specific question: across the markets where comparable data exists, what fraction of a vehicle's original transaction price is recovered at a given ownership interval, normalised by mileage. It does not measure mechanical reliability, breakdown frequency, perceived quality or customer satisfaction — those are tracked in our separate reliability index, which is methodologically independent. The two indices are designed to be read together; vehicles can score well on one and poorly on the other, and the divergence is itself informative.
Data aggregation methodology
The 2020 tracker combined five input streams. Each stream was weighted by sample size and by the time horizon it covered, then re-projected onto a common percentage-of-list-price scale. Forecast-based and auction-based sources are reconciled separately before being combined, because the two have systematically different biases — forecasts tend to be optimistic for premium segments and pessimistic for compact, while auction data tends to overweight fleet disposals.

| Source stream | Geographic scope | Type | Weight in 2020 tracker |
|---|---|---|---|
| ALG (Automotive Lease Guide) residual forecasts | United States, Canada | Forecast | 25% |
| Manheim Used Vehicle Value Index | United States | Auction | 15% |
| Schwacke EuroTaxGlass's residual values | Germany, Austria, Switzerland | Forecast | 25% |
| Glass's Guide trade values | United Kingdom, Ireland | Trade observation | 20% |
| BCA (British Car Auctions) average sale data | United Kingdom, France | Auction | 15% |
The detailed scoring procedure — including the per-stream mileage normalisation, the reconciliation between forecast and auction inputs, and the handling of low-volume model lines — is documented in our companion article on the reliability scoring methodology, which sets out the broader index-construction principles applied across both this tracker and the reliability index. Readers reproducing the tracker for academic or commercial purposes should start there.
Per-segment depreciation curves
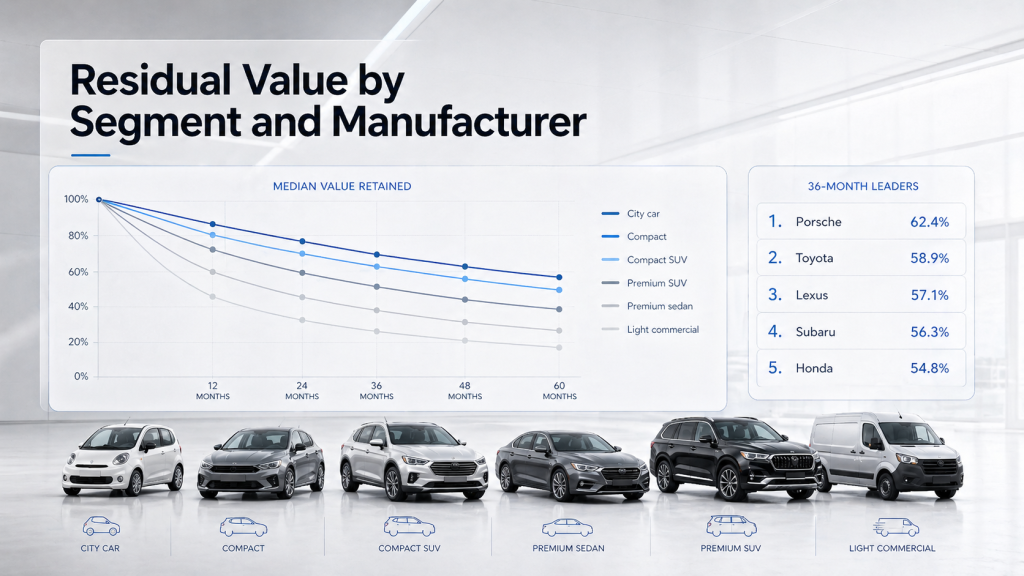
Aggregated across all manufacturers and all five input streams, the 2020 tracker produced the following segment-level curves. Values shown are the median percentage of original list price retained at each ownership interval, with the high and low bounds across input streams in parentheses. Premium segments lose value faster in the first three years but stabilise sooner; compact segments hold value better in absolute percentage terms but exhibit much steeper mileage penalties beyond 80,000 km.
| Segment | 12 months | 24 months | 36 months | 48 months | 60 months |
|---|---|---|---|---|---|
| City car (A) | 78% (74–82) | 66% (62–70) | 56% (52–60) | 48% (44–52) | 41% (37–45) |
| Compact (B/C) | 76% (72–80) | 64% (60–68) | 54% (50–58) | 46% (42–50) | 39% (35–43) |
| Mid-size sedan (D) | 72% (68–76) | 58% (54–62) | 48% (44–52) | 40% (36–44) | 33% (29–37) |
| Compact SUV | 79% (75–83) | 67% (63–71) | 57% (53–61) | 49% (45–53) | 42% (38–46) |
| Mid-size SUV | 74% (70–78) | 61% (57–65) | 51% (47–55) | 43% (39–47) | 36% (32–40) |
| Premium sedan (E/F) | 68% (64–72) | 52% (48–56) | 40% (36–44) | 32% (28–36) | 26% (22–30) |
| Premium SUV | 71% (67–75) | 56% (52–60) | 44% (40–48) | 36% (32–40) | 29% (25–33) |
| Light commercial | 75% (71–79) | 62% (58–66) | 52% (48–56) | 43% (39–47) | 35% (31–39) |
Aggregated by Global Auto Index from ALG, Manheim, Schwacke EuroTaxGlass's, Glass's Guide and BCA published data, 2020. Bounds reflect inter-source variance; mileage assumption is 15,000 km/year for European sources and 12,000 mi/year for North American sources, normalised.
Residual value by manufacturer (2020 baseline)
The table below summarises the 36-month residual-value scores for the twelve manufacturers with the largest sample sizes across all five input streams. Scores represent the average percentage of original list price retained at 36 months across all that manufacturer's passenger model lines, weighted by 2019 sales volume. These are the original published values and are retained here for reference; the 2024–2025 refresh is shown separately in section 7.
| Manufacturer | 36-month residual | Strongest segment |
|---|---|---|
| Porsche | 62.4% | Premium SUV |
| Toyota | 58.9% | Compact SUV |
| Lexus | 57.1% | Premium SUV |
| Subaru | 56.3% | Compact SUV |
| Honda | 54.8% | Compact |
| Mazda | 53.2% | Compact |
| BMW | 49.7% | Premium SUV |
| Audi | 48.5% | Premium SUV |
| Mercedes-Benz | 47.9% | Mid-size SUV |
| Volkswagen | 46.2% | Compact |
| Ford | 43.0% | Pickup (US sample) |
| Renault | 38.1% | City car |
Aggregated by Global Auto Index from the five input streams listed in section 2, 2020 baseline data. Sales-volume weighting applies within each manufacturer; ranges across input streams are typically ±2 percentage points. Specialist sub-brands (AMG, M, RS, etc.) are excluded from the parent-brand averages and tracked separately.
Powertrain effects on residual value
Powertrain choice affects residual value independently of brand and segment. The 2020 tracker separated the effect by holding segment and brand fixed and comparing equivalent trim levels across powertrain options. The results below describe the residual delta — positive means the powertrain retains more value than the segment-and-brand average, negative means less.
- Petrol turbo (downsized) — baseline reference, by definition delta of zero.
- Petrol naturally aspirated — delta of +1.5 to +2.5 percentage points at 36 months in markets where buyers value mechanical simplicity, neutral to slightly negative elsewhere.
- Diesel — delta of −4 to −6 percentage points in European urban markets following the 2017–2019 emissions controversy, neutral in North America (where diesel passenger penetration is low) and slightly positive in commercial-vehicle segments.
- Hybrid (full) — delta of +3 to +5 percentage points across all major markets, driven by fuel-cost expectations and growing preference among certified-used buyers.
- Plug-in hybrid — delta of −2 to −4 percentage points in 2020, reflecting consumer uncertainty about battery longevity and tax-incentive expiry; the 2024–2025 refresh moved this closer to neutral.
- Battery electric — delta of −8 to −12 percentage points in 2020, the largest single powertrain effect; the 2024–2025 refresh shifted this materially, see section 7.
The diesel and battery-electric deltas are the most market-sensitive and recalibrated most heavily in the 2024–2025 update. Readers using the tracker for residual-value forecasting at the model level should always cross-reference the latest powertrain-delta table rather than applying the 2020 baseline values directly.
Comparison with other public residual indices
Several other residual-value indices are publicly available, each with its own methodology and geographic bias. The 2020 tracker was deliberately designed to be additive rather than competitive with those sources; researchers cross-referencing the data should be aware of the differences.
- ALG publishes annual residual forecasts focused on the U.S. and Canadian markets, derived from a proprietary model that incorporates manufacturer-incentive data unavailable to most third parties.
- The Manheim Used Vehicle Value Index is auction-based and updated monthly, providing a near-real-time signal that complements forecast-based sources but covers only the U.S.
- Schwacke, now part of EuroTaxGlass's, is the dominant residual-value reference in the German-speaking markets and is the basis for most fleet-leasing residual contracts in those countries.
- Glass's Guide covers the UK and Ireland with weekly updates and is widely used by both trade buyers and finance houses for residual reference.
- The Wikipedia overview of depreciation provides the underlying accounting framework; the residual-value question is a specific applied case of the broader concept.
2024–2025 update: what changed
The 2024–2025 refresh of the underlying source data, applied retroactively to the 2020 baseline, produced four notable shifts. First, the battery-electric powertrain delta moved from −10 percentage points (2020 average) to approximately −3 percentage points by mid-2025, driven by a combination of falling new-EV list prices, established second-hand demand, and improving consumer confidence in battery longevity. Second, the diesel delta deepened further in European urban markets, reaching −7 to −9 percentage points in cities with active low-emission-zone restrictions.
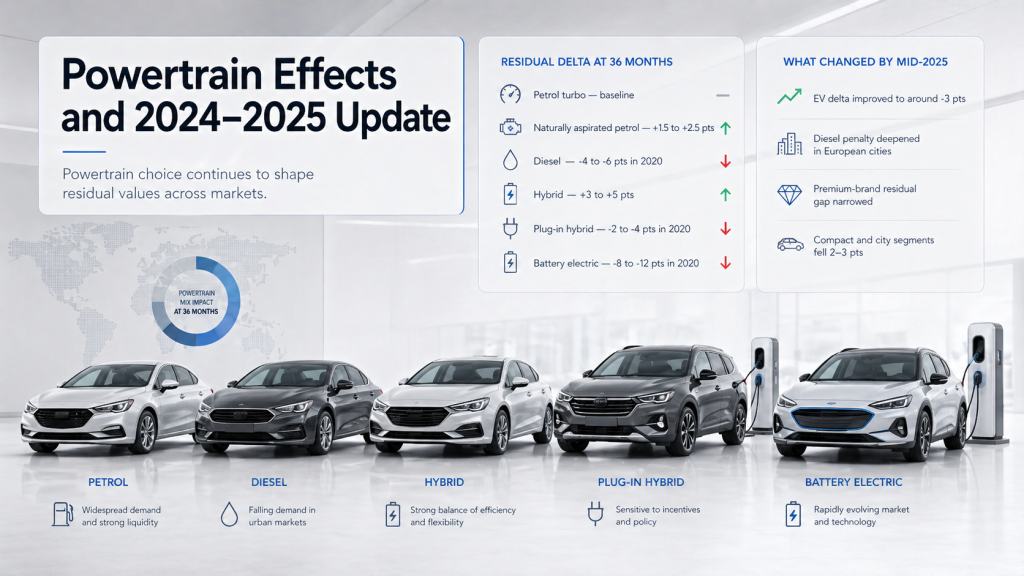
Third, the convergence between premium-brand residual values that was visible in the reliability dataset for the same period also appears in the depreciation data: the 36-month residual gap between Audi, BMW and Mercedes-Benz narrowed from a 1.8-point spread in 2020 to a 0.6-point spread in the 2024–2025 refresh. Fourth, residual values for compact and city segments declined by 2 to 3 percentage points across all major markets, reflecting the broader shift in new-car buying away from those segments — fewer comparable second-hand transactions means thinner price discovery and lower realised values.
Limitations and methodology notes
- The 2020 tracker assumes comparability between forecast-based and auction-based sources after the explicit reconciliation procedure documented in the methodology article. Researchers preferring a single-type aggregation should select either the forecast streams (ALG, Schwacke) or the auction streams (Manheim, BCA) and rebuild the index from that subset alone.
- Sample sizes for low-volume manufacturers and specialist sub-brands are insufficient for an individual residual score; those entities are excluded from the per-make table but contribute to segment averages where the parent brand is included.
- Mileage normalisation assumes a linear penalty above the segment-typical annual mileage. For ownership scenarios at the extremes — sub-5,000 km annual mileage or above 30,000 km annual mileage — the tracker's residual estimates should be treated as indicative only, with reference to source-stream mileage tables rather than the headline figure.
- Forecast-based sources publish forward-looking residuals in the year before the relevant ownership interval is reached; auction-based sources publish realised values in retrospect. The reconciliation procedure aligns both onto a common reference date, but a small lag remains and is documented in the methodology article.
- The tracker is updated annually. Significant single-event shocks — fuel-tax changes, emissions-zone announcements, OEM-specific incident effects — are captured in the next annual refresh rather than mid-year.
Frequently asked questions
Is the Global Vehicle Depreciation Tracker a primary research source?No. It is a meta-index that aggregates and normalises five publicly available primary sources. All primary data remains the property of its respective publisher and is cited inline.Why is ALG weighted so heavily despite covering only North America?ALG's sample size and the depth of its incentive-adjusted methodology are unmatched in the dataset. The weighting is documented in the methodology article and is reviewed annually; it has not changed since the 2020 release.How does the tracker handle electric vehicles given the rapid market shift?The 2020 baseline included EVs only where sample sizes met the minimum threshold. The 2024–2025 refresh expanded EV coverage substantially and recalibrated the powertrain-delta tables. Direct comparison between the 2020 and 2024 EV residuals is therefore not advised; use the powertrain-specific delta tables instead.Why are 36-month residuals the headline figure rather than 60-month?36 months is the most common consumer ownership interval in the markets covered by the tracker, the most common lease length in North America, and the interval at which forecast accuracy is highest across all five input sources. 60-month residuals are reported but carry wider uncertainty bounds.How does this tracker differ from a total-cost-of-ownership calculation?The tracker measures only residual value retention. Total cost of ownership additionally incorporates fuel, insurance, maintenance, financing and taxation costs, which are tracked separately and combined where required for full TCO modelling.Can the tracker be reproduced from public data?Partially. Three of the five source streams publish summary data without subscription; the remaining two (ALG and Schwacke) require commercial access for the full underlying dataset, though top-line figures from both are widely cited in industry reporting and recoverable from secondary sources.How often is the tracker updated?Annually, in the second quarter, after all five input streams have published their previous-year data and the residual forecasts for the coming year are available.
